The Hidden Pitfall of Ignoring Smart Aquarium Monitor Data Trends
Smart aquarium monitor data interpretation starts with a deceptively simple question: is the latest number important because it is outside a preferred range, or because it is moving in a direction that reveals a problem before an obvious alert appears? That distinction changes how a hobbyist can use connected aquarium technology. A monitor can report temperature, pH, dissolved oxygen, conductivity, or nitrogen-related measurements continuously, but the value of the system is not simply the presence of more numbers. The real information often sits in the sequence of readings.
That sequence matters because an aquarium is a biological system. Fish produce waste, microbes transform nitrogen compounds, filters move water through different treatment stages, plants and algae alter gas and nutrient dynamics, and maintenance changes the system again. University guidance describes the importance of biological filtration to remove toxic substances, while aquaculture research increasingly uses connected sensors to collect environmental observations continuously. The practical lesson is not that every hobbyist needs sophisticated analytics. It is that historical context can turn an isolated alert into an understandable change in the aquarium.
Why a single aquarium reading can be misleading
An individual reading is a snapshot. A trend is a relationship between snapshots. That difference is easy to overlook when a phone notification announces that one parameter has crossed a user-defined threshold.
Consider temperature. A reading that is acceptable at one moment may still deserve attention if it has been climbing steadily for several days. The opposite can also happen: a brief fluctuation may look dramatic on a graph but mean little if the value quickly returns to its normal pattern and there is no corresponding change in other measurements.
The same reasoning applies to pH. A tank does not exist in a vacuum, and pH can change in response to biological activity, buffering capacity, gas exchange, water changes, and other factors. Looking only at the current number can obscure whether the aquarium is stable, gradually drifting, or experiencing a short-lived disturbance.
University and aquaculture guidance repeatedly treats water quality as a set of interacting variables rather than one universal number. Oklahoma State University Extension, for example, identifies ammonia, nitrite, nitrate, pH, temperature and dissolved oxygen as important parts of water-quality management. That does not mean every home aquarium needs to measure every parameter continuously. It does mean that a meaningful interpretation should consider the aquarium's species, system design, and recent changes.
The evidence: aquarium health is a process, not an alert
One of the strongest reasons to examine historical data is the nitrogen cycle. Fish release nitrogenous waste, and biological filtration provides an environment where microorganisms transform ammonia through successive stages. If that biological process is disturbed, a sequence of readings can reveal more than a single alert.
For example, a rising ammonia measurement followed later by a nitrite increase is different from a solitary, unexplained ammonia spike. The first pattern may be consistent with a change in biological processing, increased waste input, disrupted filtration, or another system-level event. It is not, by itself, a diagnosis, but it gives the aquarist a question to investigate.
University of Florida IFAS Extension explains that aquariums need filtration capable of removing substances such as ammonia and that excessive feeding can contribute to deterioration in water quality. Oklahoma State University Extension similarly explains the conversion of ammonia to nitrite and then nitrate in biological systems. These sources support a useful interpretive principle: when related parameters move in sequence, the pattern can contain information about the underlying process.
This is why an aquarium smart monitor should be thought of as a recorder as well as an alarm. An alarm says, “look now.” A history can help answer, “what changed before now?”
What historical trends can reveal
Historical data is particularly useful when it helps connect an environmental change with a plausible event. The connection should be treated as a hypothesis rather than proof.
The table illustrates an important limitation: trend analysis is an evidence-organizing method, not an automatic diagnosis. A graph can tell you that two things changed together. It cannot establish that one caused the other.
Consistency is what makes a trend trustworthy
A historical chart looks scientific even when the underlying measurements are inconsistent. If readings are taken at different locations, different times, with different procedures, or with equipment in different conditions, apparent trends can partly reflect the measurement process rather than the aquarium.
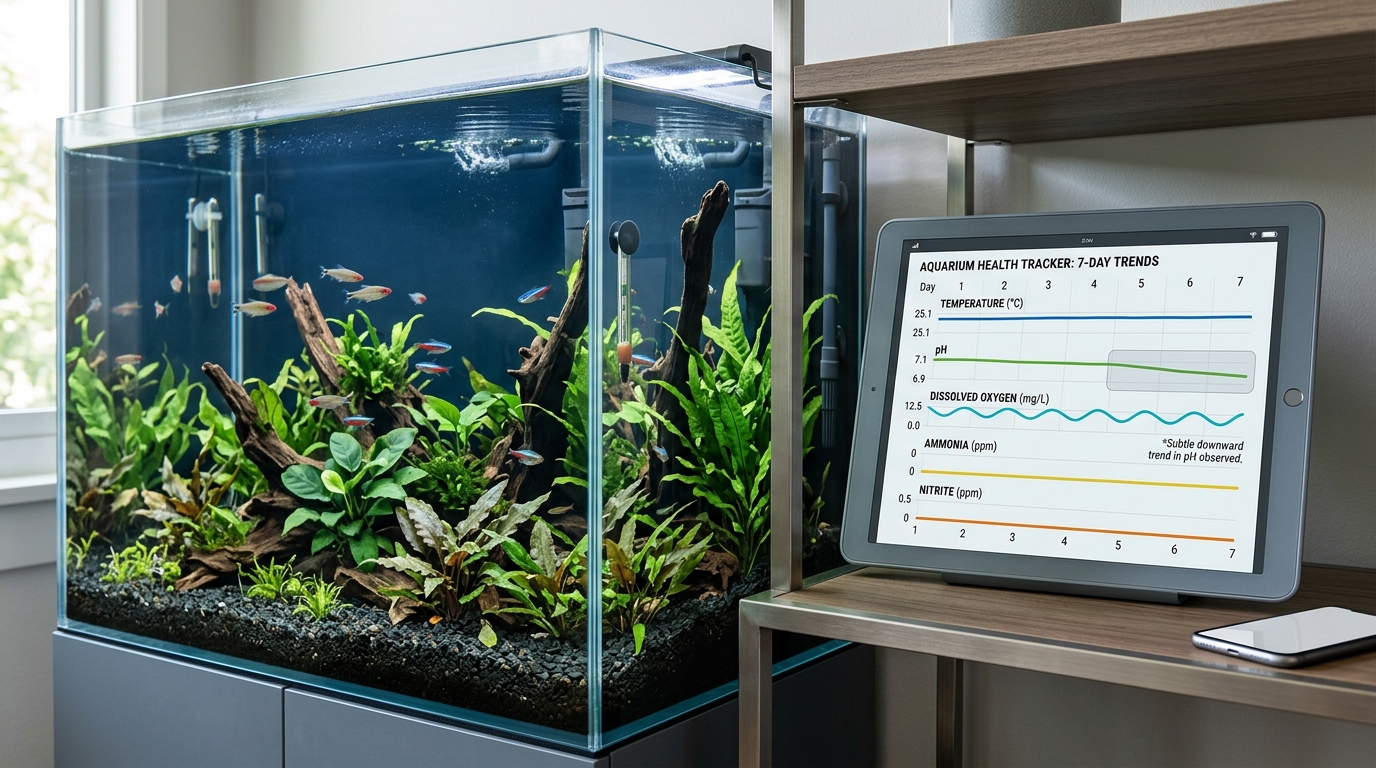
That is why the Southern Regional Aquaculture Center emphasizes practices that allow operators to compare changes in water quality from one day to the next. Its guidance recommends consistency in sampling location, timing, procedures, and equipment and notes that graphing ammonia and nitrite can make changes in biofilter activity easier to visualize.
The principle transfers well to home aquariums. A monitor that automatically records at regular intervals has an advantage because it reduces some forms of human inconsistency. But automatic collection does not remove all measurement problems. Sensor fouling, calibration drift, poor placement, bubbles, electrical interference, changing water flow, and maintenance events can all affect readings depending on the device and parameter.
For that reason, a useful aquarium data history should ideally contain two layers: the sensor record and a simple contextual record. The second layer can include water changes, filter cleaning, feeding changes, new livestock, medication, equipment changes, power interruptions, unusual room temperatures, and other events that might explain a shift.
Do not confuse correlation with diagnosis
This is where smart-monitor enthusiasm can become counterproductive. A graph may show that pH fell after a maintenance event. It may show that temperature rose while dissolved oxygen fell. It may show ammonia changing after a feeding increase. Those relationships are worth investigating, but they are not proof of causation.
There can also be multiple causes for the same pattern. A drop in dissolved oxygen, for instance, may relate to temperature, water movement, biological oxygen demand, aeration, stocking conditions, or other factors. Recent peer-reviewed work on aquaculture monitoring describes connected measurements of variables including dissolved oxygen, ammonia, pH, temperature, and turbidity, reinforcing the value of collecting multiple environmental signals rather than treating one metric as a complete picture.
The practical rule is simple: use the trend to form the question, then use independent evidence to test the question.
If a sensor says ammonia suddenly increased and the fish appear normal, do not assume either that the sensor is wrong or that the fish are safe. Check the reading using another appropriate method and inspect the surrounding system. If an independent test confirms the change, investigate the aquarium's biological and mechanical context. If the independent result conflicts sharply with the automated measurement, investigate the sensor before building a larger theory around the graph.
When an alert should override trend-watching
Trend analysis should never become an excuse to wait during an obvious water-quality emergency. Some changes require immediate attention because a dangerous condition can develop faster than a hobbyist's preferred analytical workflow.
This distinction creates a useful decision rule. If the fish are in obvious distress or a critical system function has failed, act on the immediate condition and verify the water as appropriate. If the aquarium is stable and the question is whether a subtle change is developing, use the historical record to investigate the pattern.
The same principle applies after maintenance. If a monitor records a sudden shift immediately after filter cleaning, a water change, medication, or another intervention, the event itself becomes part of the evidence. That does not prove the intervention caused the shift, but it makes the timing relevant.
The hidden value of combining several trends
One of the most useful features of connected monitoring is the ability to place different variables on the same timeline. The goal is not to create a complicated dashboard. It is to identify relationships that deserve closer examination.
Suppose temperature rises during a particular part of the day while dissolved oxygen repeatedly declines during the same interval. That recurring relationship is more informative than either number viewed alone. Similarly, if ammonia begins increasing after a change in feeding and filter flow also decreases, the combined timeline suggests several concrete questions: did the increased waste load exceed processing capacity, did reduced flow affect biological filtration, or did both observations result from another event?
Again, the timeline does not answer those questions automatically. It helps prioritize them.
Recent research on IoT-based aquaculture monitoring also illustrates an important methodological point: automated measurements can be useful when paired with calibration checks and cross-validation against manual observations. For a hobbyist, this translates into a modest but powerful habit: when a trend looks surprising, verify before interpreting.
Who benefits most from trend interpretation?
Historical monitoring is especially useful for aquariums where conditions can change gradually or where several variables interact. This may include systems with sensitive livestock, substantial equipment, frequent environmental changes, or recurring maintenance questions.
It can also be valuable for beginners because a history can make cause-and-effect thinking easier to learn. Instead of seeing “pH 7.4” as an isolated fact, the aquarist can ask whether pH has been stable, whether it changes after water changes, and whether other measurements move with it.
But continuous trend analysis is not equally necessary for every aquarium. A simple, stable system may gain little from tracking a large number of variables around the clock. More data can also create false confidence if the measurements are inaccurate or if the user interprets generic thresholds without considering the species and system.
The evidence from ornamental-fish guidance is explicit about this limitation: Tolerance of parameters is species dependent. A number that is acceptable in one context may be inappropriate in another. Therefore, the purpose of historical data is not to create one universal “healthy aquarium” graph. It is to understand whether a particular system is changing relative to its appropriate baseline.
A practical action checklist for using monitor history
- Establish a baseline: Review a period when the aquarium was considered stable and identify its normal range and daily pattern.
- Track context: Record water changes, feeding changes, new livestock, filter maintenance, equipment changes, and unusual environmental events.
- Look for direction: Ask whether a parameter is stable, drifting, cycling predictably, or changing abruptly.
- Compare related variables: Examine temperature, pH, dissolved oxygen, and nitrogen-related readings together when they are available and relevant.
- Check the timing: Determine whether a change occurs after a repeatable event such as feeding, lighting, maintenance, or a daily temperature cycle.
- Verify surprising readings: If one sensor produces an unexpected result, use an appropriate independent measurement before drawing a strong conclusion.
- Inspect the hardware: Check sensor placement, cleanliness, calibration status, power, water movement, and connectivity when the data suddenly becomes implausible.
- Use species-appropriate context: Do not apply a generic threshold without considering the fish, invertebrates, plants, salinity, temperature, and system design.
- Act first during emergencies: Acute distress or obvious equipment failure takes priority over extended trend analysis.
- Review the graph after the event: Once the immediate problem is controlled, examine the preceding data to identify what may have changed before the alert.
A simple decision framework for interpreting an unexpected trend
A useful workflow can be reduced to four questions.
- Is the change real? If the reading is surprising, verify it with an independent method where practical.
- Is the change isolated? If only one measurement moved, investigate measurement quality and the parameter itself. If several related measurements moved, consider a system-level explanation.
- Is there a plausible event? Compare the timing with feeding, water changes, filter maintenance, livestock changes, equipment problems, temperature shifts, or other known events.
- Does the aquarium show biological consequences? Fish behavior and appearance are additional observations. They should not replace water testing, but they can help determine the urgency of investigation.
If the reading is independently confirmed and the trend is persistent, investigate the aquarium rather than merely clearing the alert. If the reading is not independently confirmed and conflicts with the rest of the dataset, investigate the measurement system before assuming the aquarium has changed. If both the sensor and independent test show deterioration, the historical record becomes a valuable map of when the change began and what happened around it.
Important limitations of smart aquarium data
Smart monitoring is not the same thing as laboratory analysis. Different sensors have different measurement principles, maintenance requirements, response characteristics, and susceptibility to interference. Some parameters are easier to measure continuously than others. A device may also report a calculated or transformed value rather than the exact chemical quantity a professional would use for diagnosis.
There is another limitation: data density can exaggerate apparent precision. A graph containing thousands of readings may look more authoritative than a carefully collected set of independent measurements, but a large number of readings from a poorly calibrated sensor does not necessarily produce better information.
There is also a scope limitation in applying aquaculture research directly to home aquariums. Commercial or experimental systems can differ substantially in stocking density, water volume, filtration, feeding, aeration, species, and management. Evidence from aquaculture can explain general principles of monitoring and water chemistry, but it should not automatically be treated as a species-specific prescription for a household aquarium.
That is why the most defensible use of a smart aquarium monitor is as one layer of an evidence system: sensor history, direct observation, maintenance records, appropriate manual testing, and species-specific knowledge all contribute different pieces of the picture.
Frequently asked questions
1. Why are trends more useful than a single aquarium alert?
A trend shows direction, persistence, timing, and relationships between readings. A single alert only describes one point in time. The trend can help determine whether a change is temporary, recurring, gradual, or associated with another event.
2. Does a normal current reading mean the aquarium is healthy?
Not necessarily. A current reading can be acceptable while a parameter is moving steadily away from the aquarium's established baseline. Historical context is useful for identifying gradual changes that have not yet produced an obvious threshold violation.
3. Should I trust a smart aquarium monitor over a manual test?
Neither should automatically be treated as infallible. Automated monitoring provides useful continuity, while independent testing can help verify unexpected readings. When the two disagree substantially, investigate calibration, sampling conditions, test method, and the specific parameter before drawing conclusions.
4. What parameters are most useful to track?
The answer depends on the aquarium. Temperature and pH are broadly useful, while ammonia, nitrite, nitrate, dissolved oxygen, salinity, alkalinity, or other variables may matter depending on species and system design. University and aquaculture sources emphasize that water-quality priorities and tolerances vary by context.
5. Can a smart monitor diagnose why ammonia increased?
No. It can document the increase and may show related changes, but the cause requires investigation. Possible explanations can include increased waste input, feeding changes, biological-filtration disruption, dead organic material, altered circulation, or measurement problems.
6. How often should historical aquarium data be reviewed?
There is no universal schedule. A quick review of recent trends during routine maintenance can reveal changes that an isolated alert would miss. More frequent review makes sense after major system changes, during cycling, or when a parameter begins behaving unusually.
7. What if the fish look normal but the trend looks bad?
Do not dismiss the trend simply because outward signs are absent. Some water-quality problems can develop before obvious behavioral changes appear. Verify the reading, inspect the system, and interpret the result using species-appropriate water-quality information.
8. Is more monitoring always better?
No. More measurements can be useful only when they are accurate, relevant, and interpretable. An oversized dashboard can distract from the few variables that actually matter for a particular aquarium. Good monitoring reduces uncertainty; it should not create unnecessary complexity.
Information synthesis: turn alerts into evidence
The hidden pitfall of ignoring smart aquarium monitor data trends is not simply that a hobbyist might miss a high or low number. The deeper problem is losing the story contained between those numbers. Aquarium conditions develop through interacting biological, chemical, mechanical, and environmental processes. A historical record can show when a change started, whether it repeats, what other variables moved alongside it, and whether an intervention altered the trajectory.
The evidence also sets clear boundaries. University sources support the importance of biological filtration, nitrogen cycling, consistent water-quality measurement, and species-dependent tolerance. Peer-reviewed research shows that connected monitoring can collect multiple environmental variables continuously and that calibration and cross-validation matter. None of those findings means an aquarium monitor can diagnose a tank by itself.
The most useful interpretation therefore follows a disciplined sequence: observe the trend, verify surprising measurements, connect the timeline to real aquarium events, consider multiple variables, and apply species-appropriate context. If the aquarium is in an acute emergency, respond to the immediate condition first. If the system is stable but slowly changing, the historical record can provide the evidence needed to investigate before a small deviation becomes a larger maintenance problem.
That is the real advantage of smart monitoring. It is not simply that the aquarium can tell you when something is wrong. It is that, when the data is collected consistently and interpreted cautiously, the aquarium can begin to show how it got there.


Comments
Post a Comment